Investigate industrial events faster.
From thousands of signals to one clearer review path: what changed, what supports it and what to check next.
Built for complex equipment, process lines and dense telemetry. Works next to your existing dashboards and data platforms.
Charts are not explanations
A dashboard can show change, but teams still need to decide what the event means and where to look first.
Good-looking matches still need review
Similarity is useful only when it remains tied to real signal context and engineering judgment.
Events have a life
Problems build up, stay active, fade and sometimes return. A single point rarely tells the full story.
The public product message is simple: find the relevant event window, keep evidence inspectable, and help engineers decide what to check next. Operational decisions stay with people.
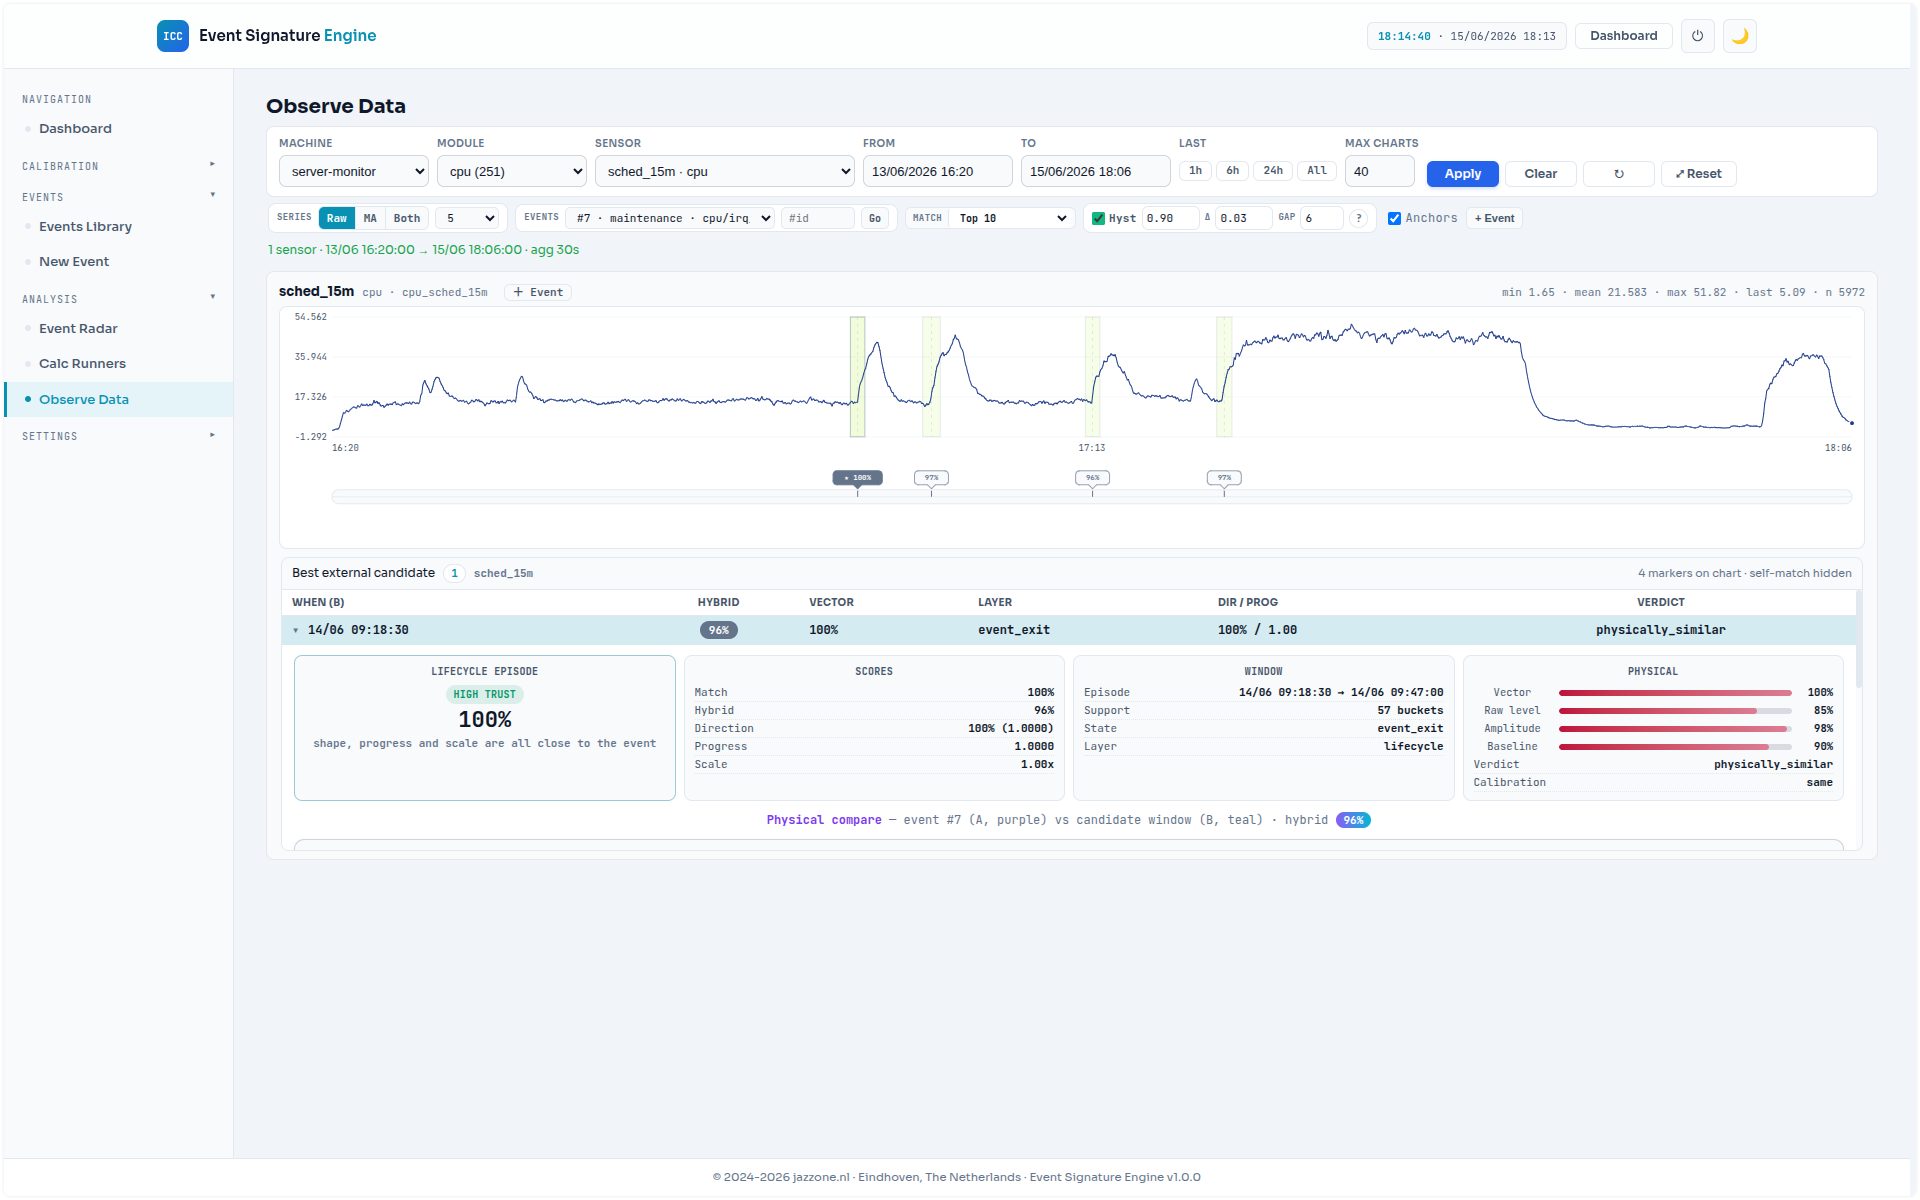
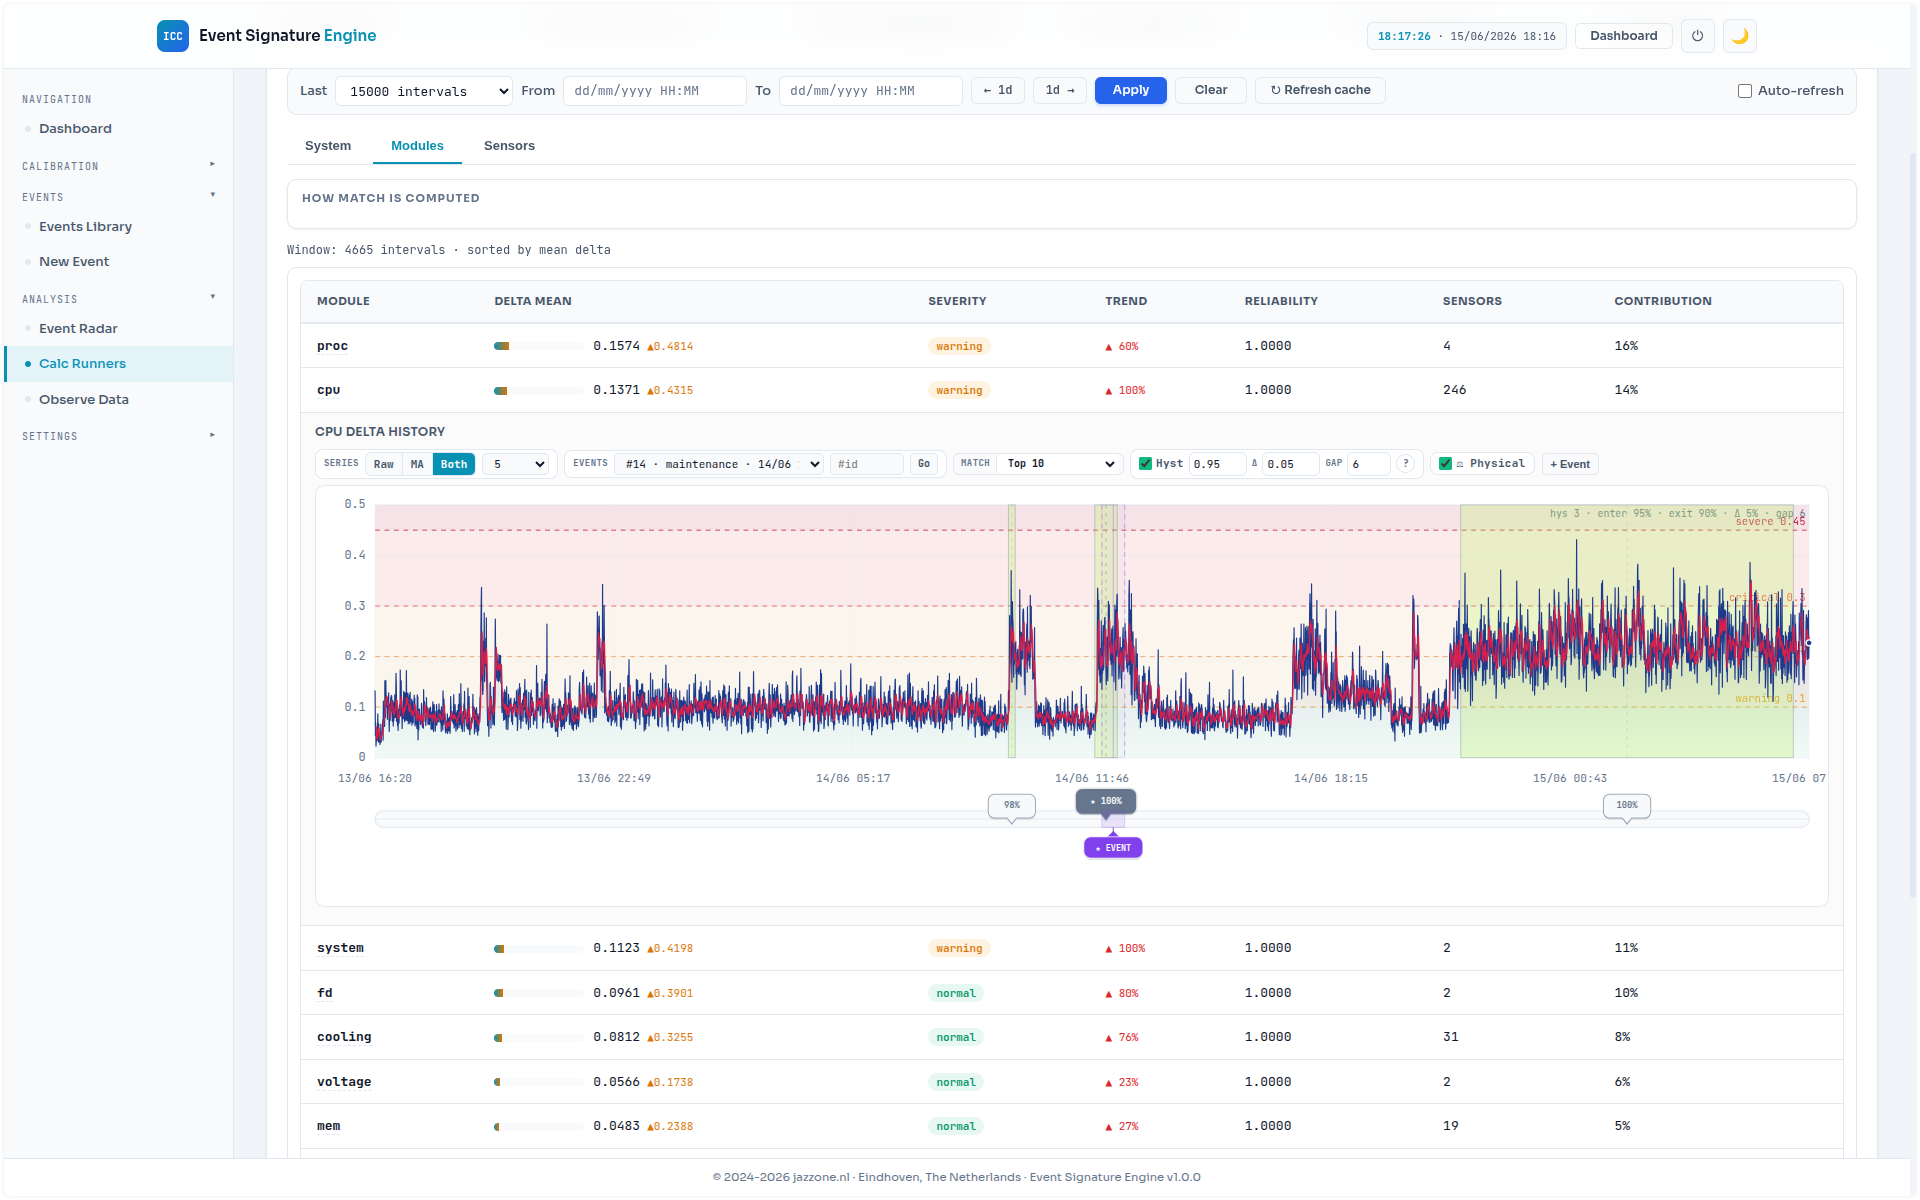
Shows episodes, not isolated dots
Related signal changes are presented as a readable event window for review.
Keeps the signal trail visible
Investigation output stays connected to the underlying telemetry context.
Supports engineers without autopilot
The product suggests checks and context. It does not operate equipment or replace operators.
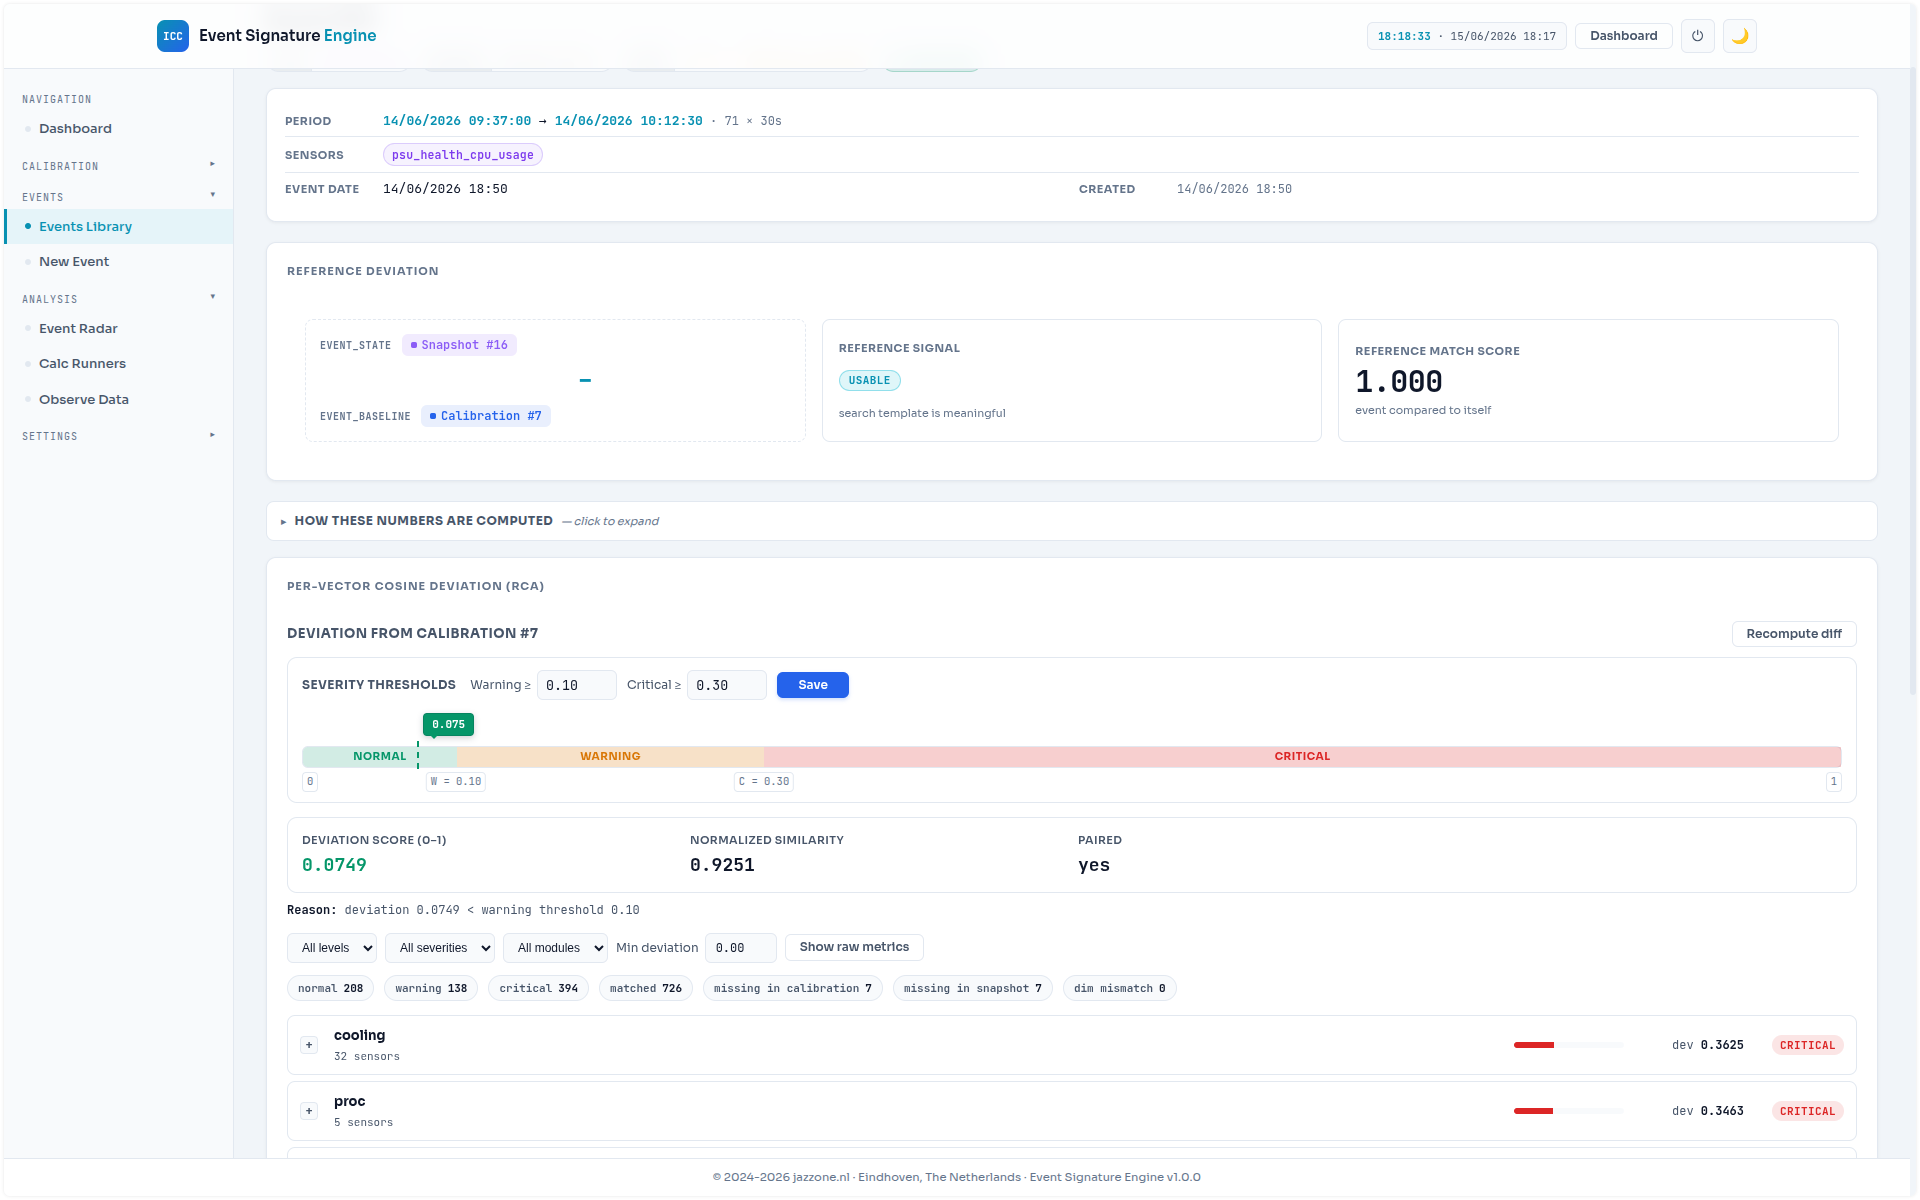
Makes confirmed cases reusable
Reviewed cases can become practical knowledge for future investigations.
No black-box verdicts
Outputs are framed as review support, not guaranteed diagnosis or automatic control.
Real, simulated or synthetic
Demos and experiments are labelled so visitors understand what they are seeing.
For teams with complex telemetry
ICC works next to dashboards, historians, alarms, SCADA and data platforms. It adds evidence, review structure and a reusable investigation trail.
Complex machines
Useful where many signals interact and one alarm rarely explains the whole event.
Slow investigations
Useful when teams lose time finding what changed and what should be checked first.
Knowledge that compounds
Useful when confirmed findings should become practical memory for the team.
Product views and demonstrations
Examples show product direction and workflow. They are not production validation, benchmark claims or guarantees.
Event timeline
A cleaner view of how an event appears and develops over time.
Evidence review
A practical way to inspect why an event is worth attention.
Signal context
Review output remains connected to the original telemetry context.
Supervised by design
No automatic operation
ICC supports review and check planning. It does not operate industrial equipment.
No guaranteed diagnosis
The product helps form and review investigation paths. It does not promise certainty.
No replacement claim
It is designed to complement existing dashboards, alarms and data systems.
Discuss Industrial Cognitive Core
Open to technical discussions, controlled evaluations and partnerships around evidence-backed industrial investigation.